Logs and tasks
Pilot records the work on your bench in three places. Use them to follow an operation and to find the cause of a failure.
| Page | Where | What it shows |
|---|---|---|
| Tasks | Insights > Tasks | Each long operation, such as a new site, a backup, or an app install, with its steps and output. |
| Logs | Insights > Logs | The log files of the bench processes, such as the web server and the background workers. |
| Activity | Pilot menu > Activity | Who did what, and when. |
Tasks
A task is one long operation. When you start an operation, such as Create Site or Back up now, Pilot opens its task page.
Go to Tasks to see all tasks. Filter the list by site, by type, or by status.
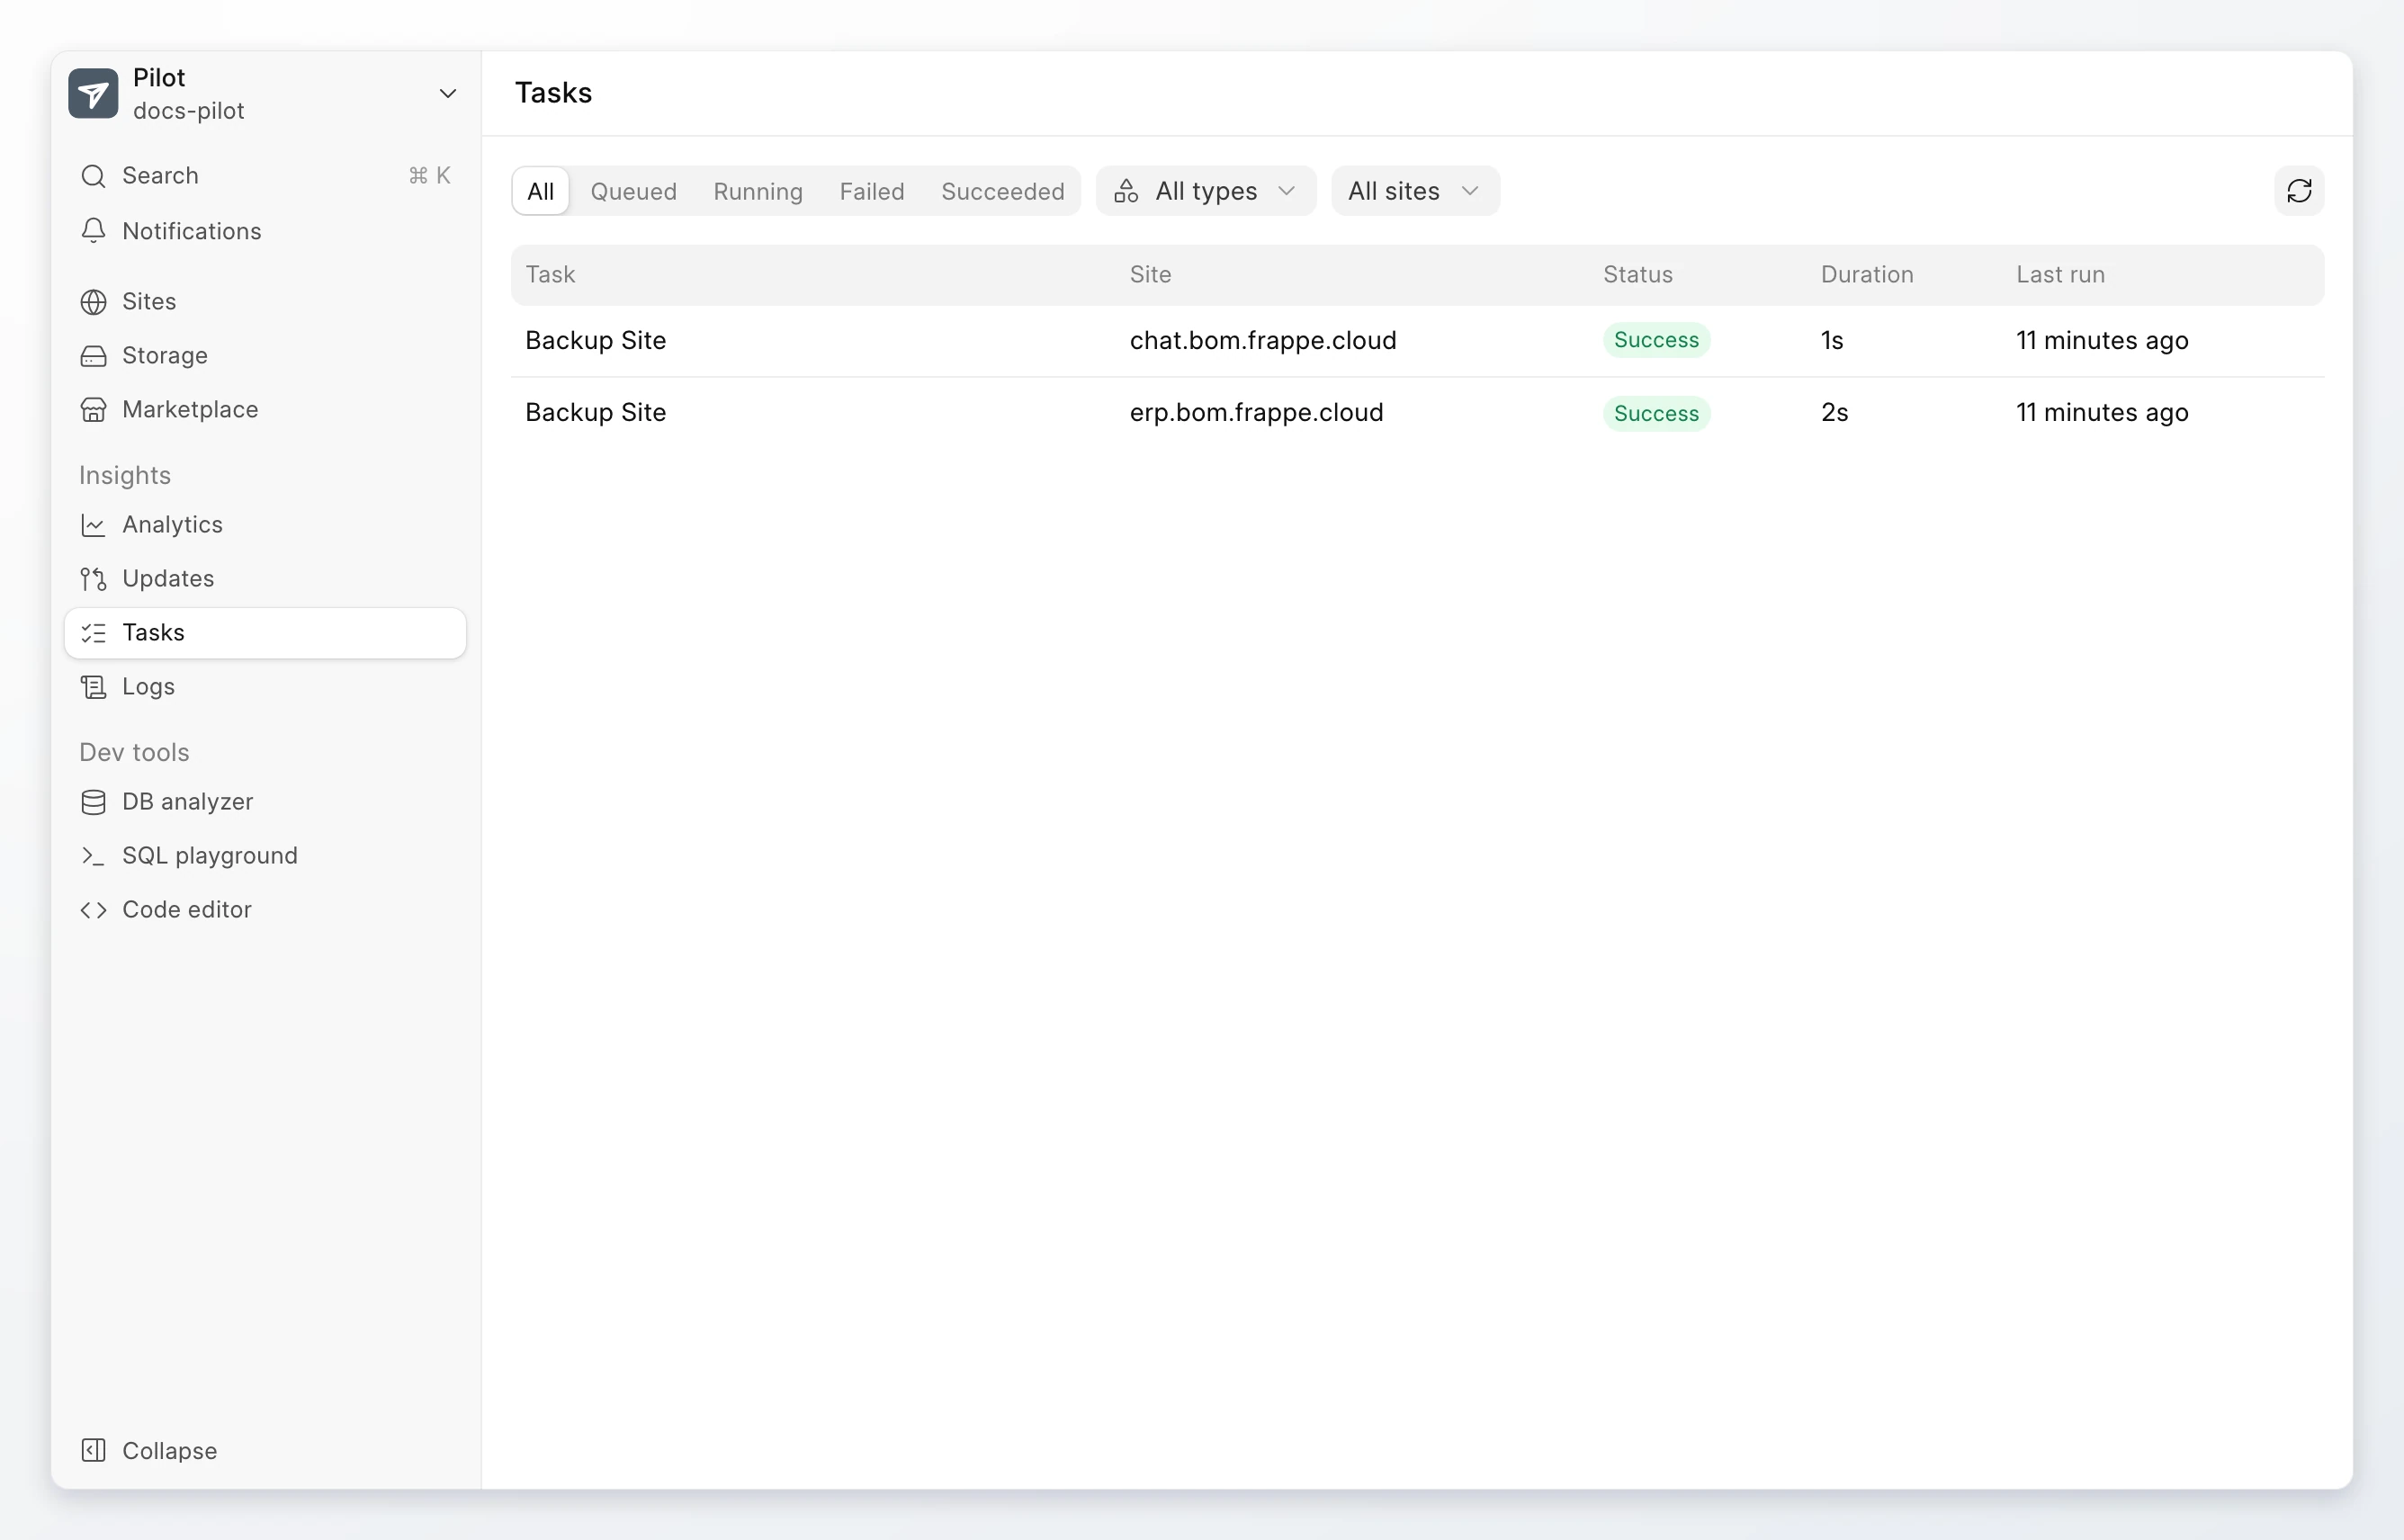
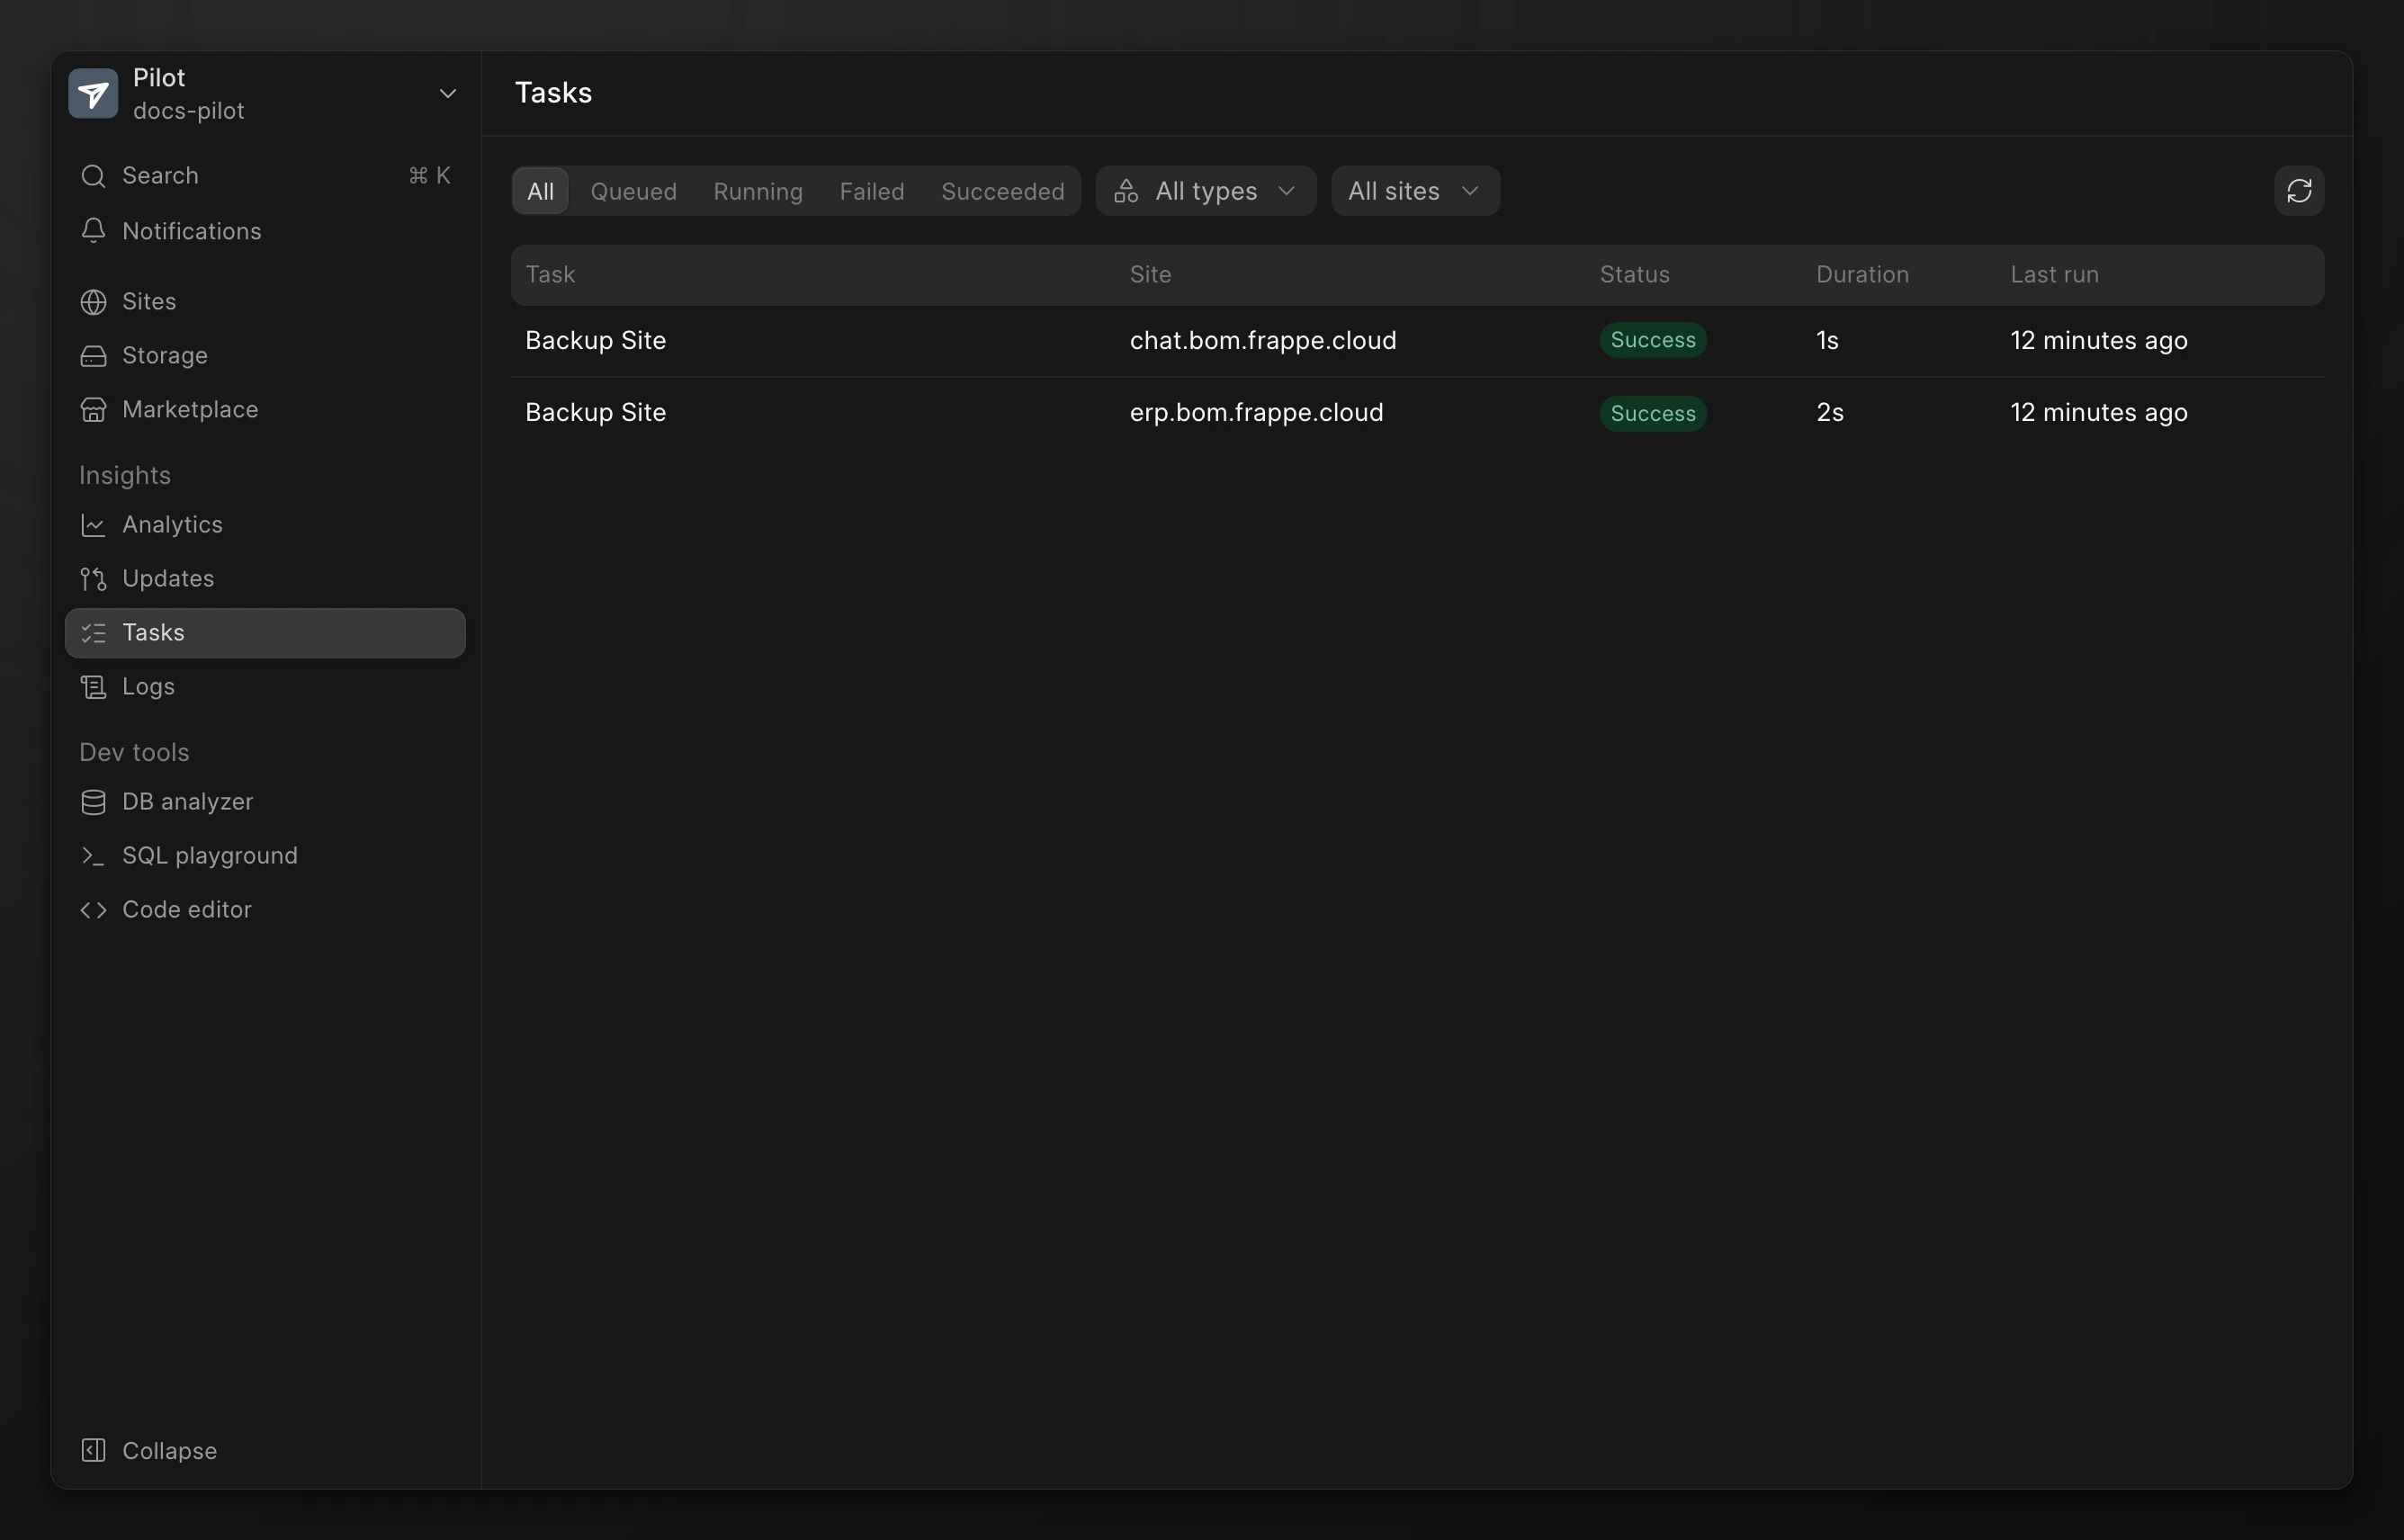
| Status | Meaning |
|---|---|
| Queued | The task waits to start. |
| Running | The task runs now. |
| Success | The task finished without errors. |
| Failed | A step of the task failed. |
| Killed | The task was stopped before it finished. |
The types are Sites, Apps, Backups, Updates, Server, and Other.
To see only the tasks of one site, click View jobs in the site actions menu.
Read a task
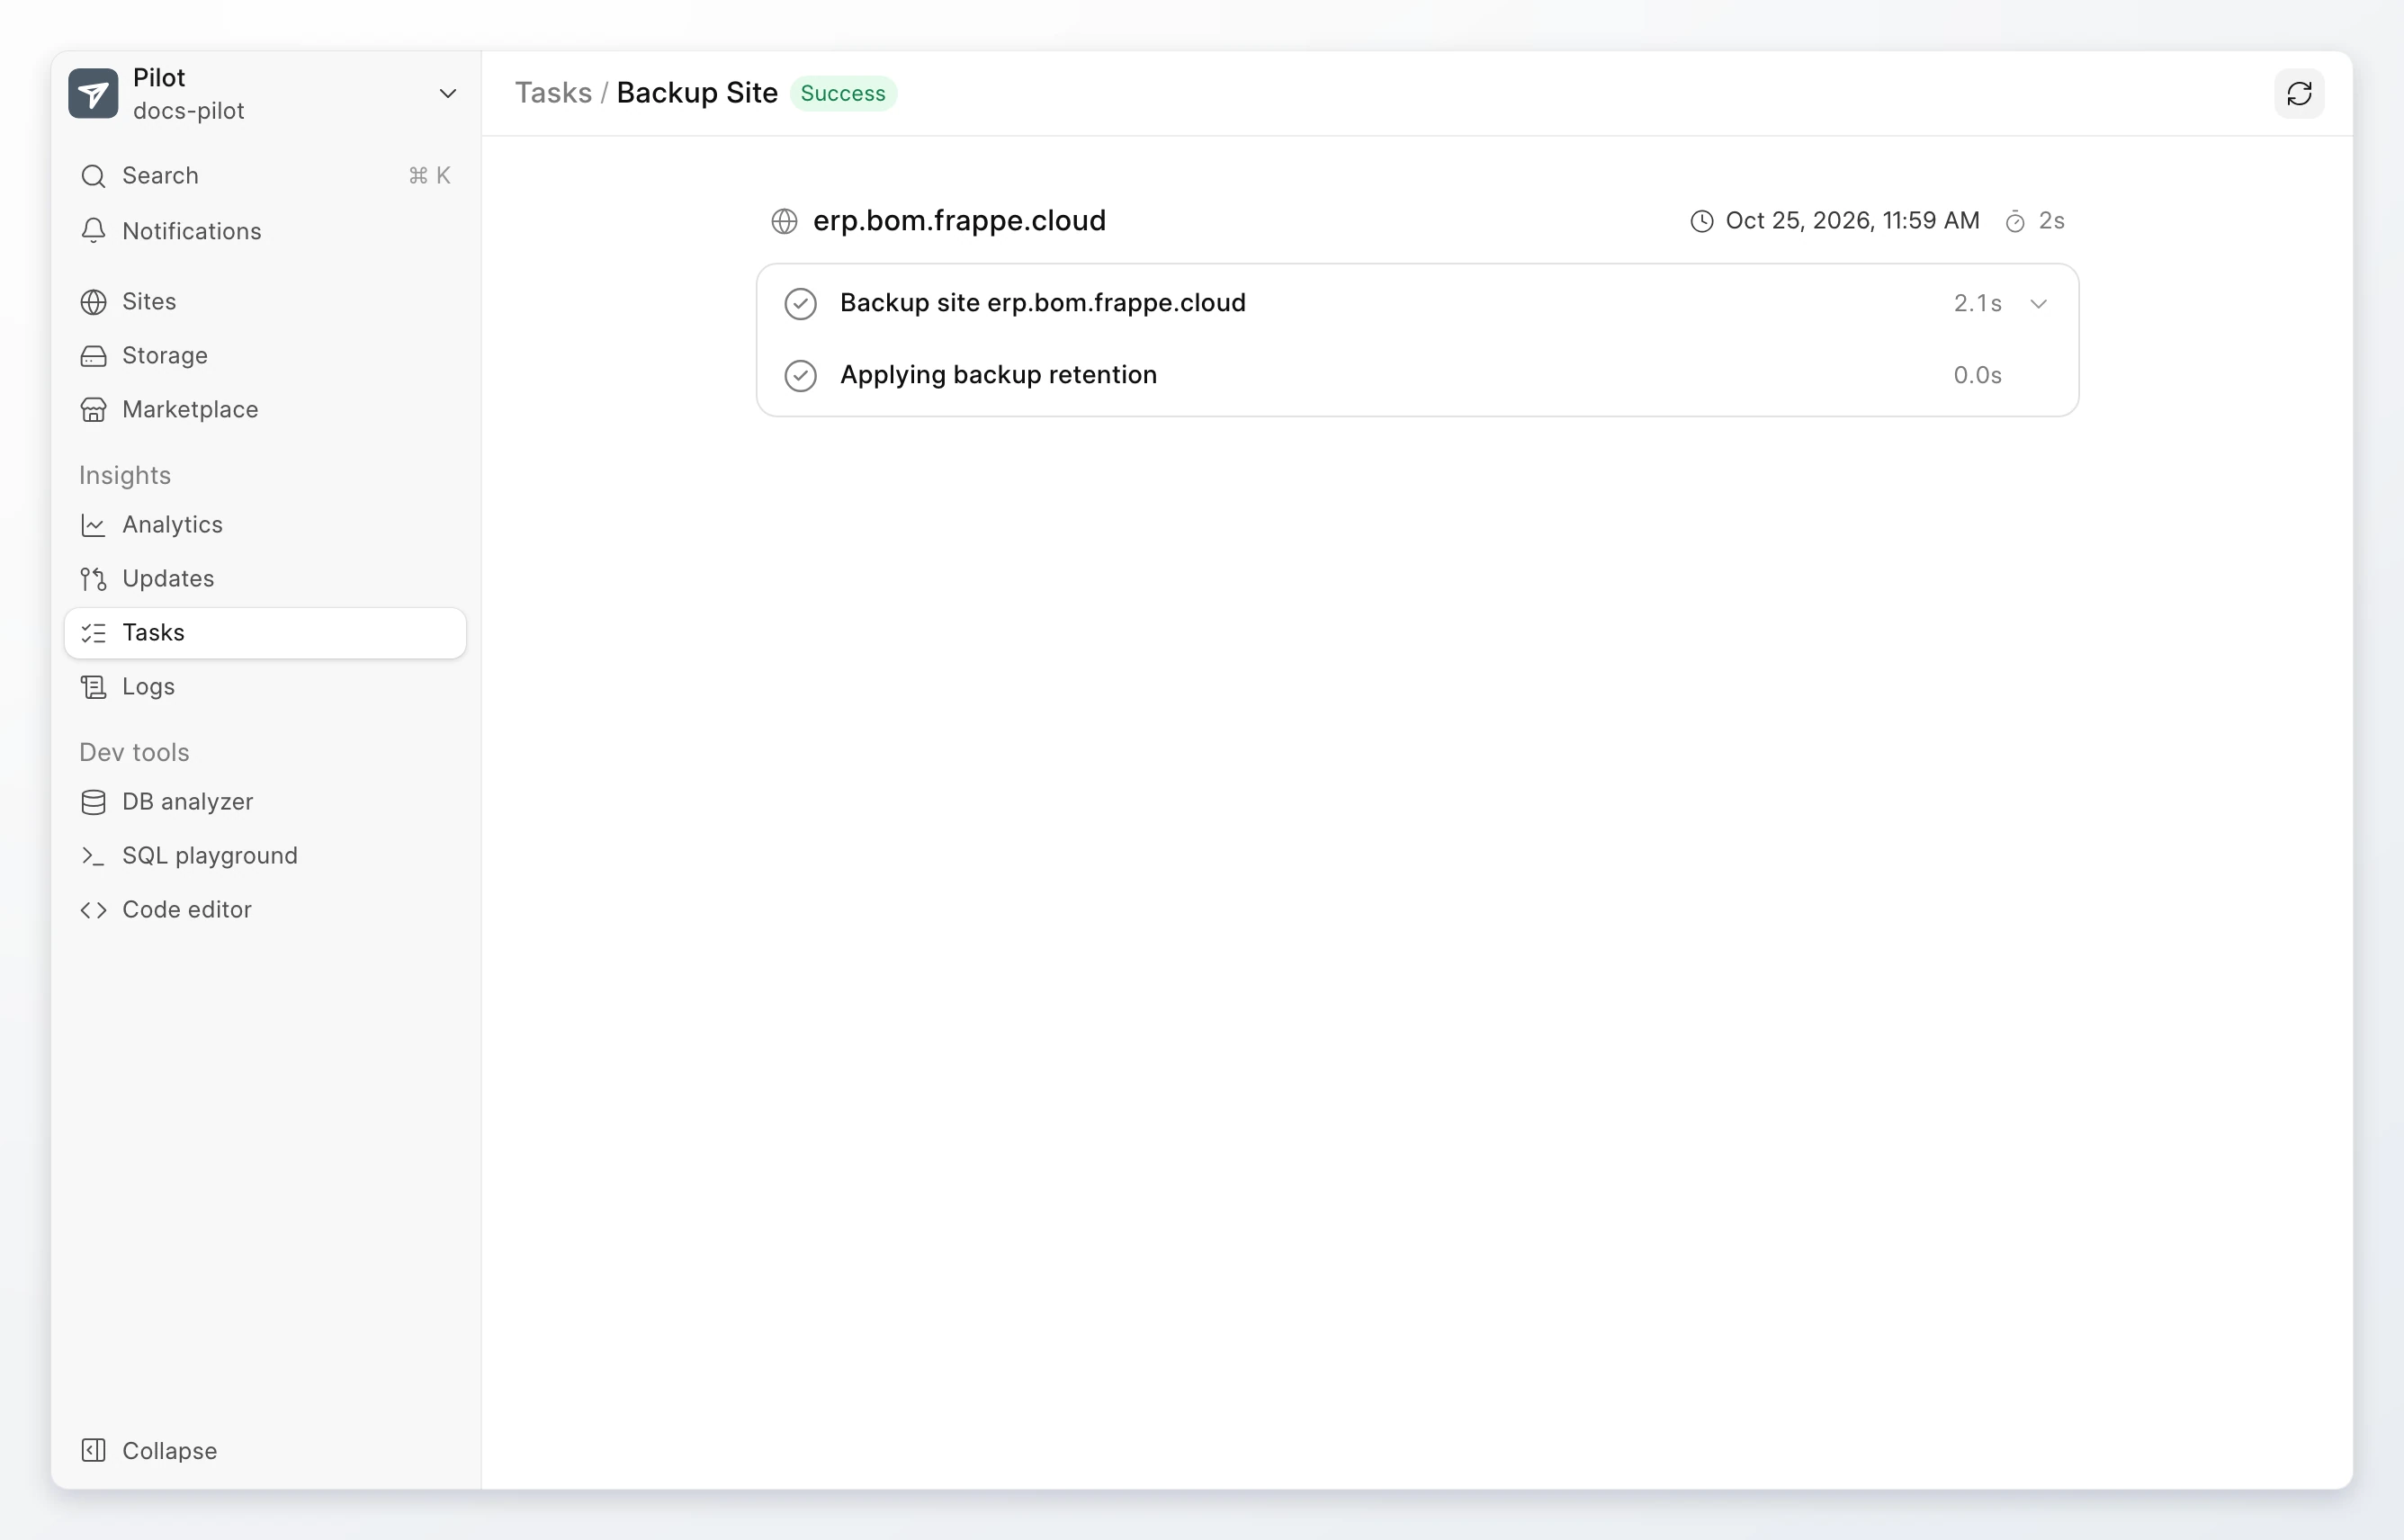
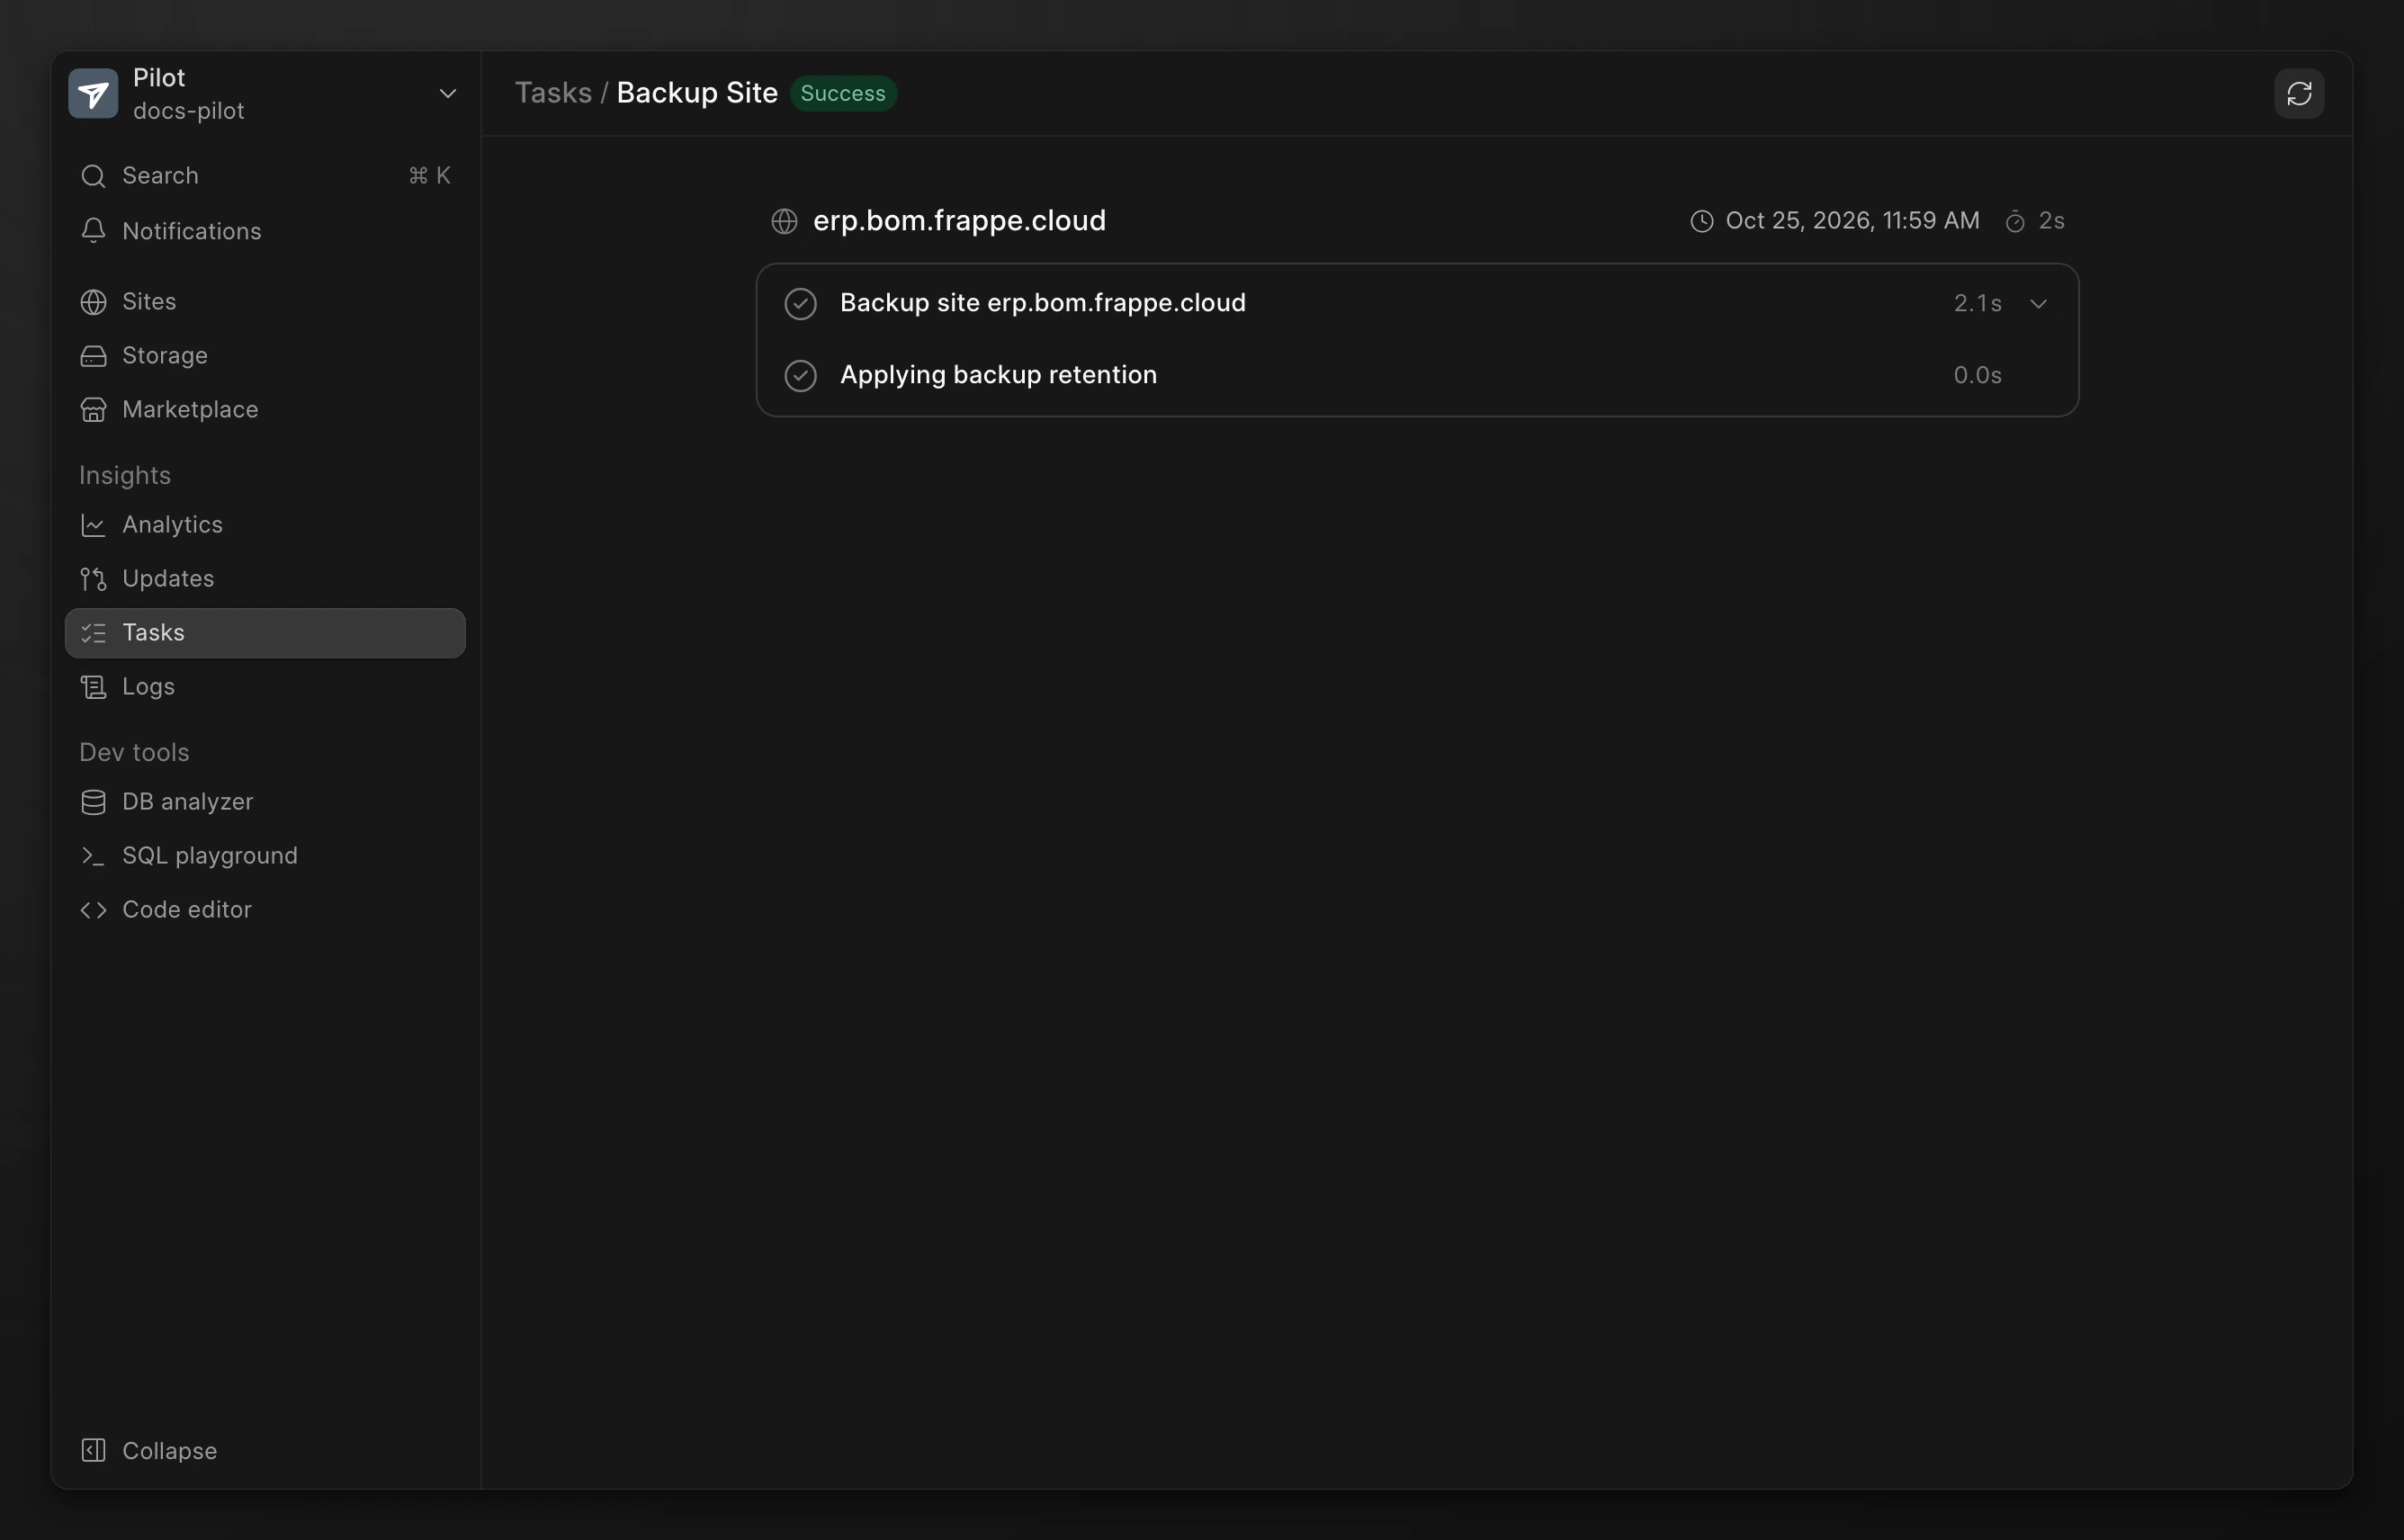
Click a task. The task page shows each step, its output, and how long it took.
- To stop a running task, click Cancel. Some steps cannot stop safely, so Pilot shows Cancel only when the task can stop.
- If a task failed and an AI assistant is connected, click Debug with AI for an explanation of the failure. Connect an assistant in Settings > General > AI assistant settings.
A failed app update or migration also shows on the Updates page, with the recovery actions. Read Updates and migrations.
Logs
Go to Logs. The page lists the log files of the bench, with the most recently changed file first.
- Select a log file. Type in Search log files to find a file by name.
- Read the newest lines. Select how many lines to show, from 100 lines to 1000 lines.
- Type in Search this log to find text. Use Next match and Previous match to move between matches.
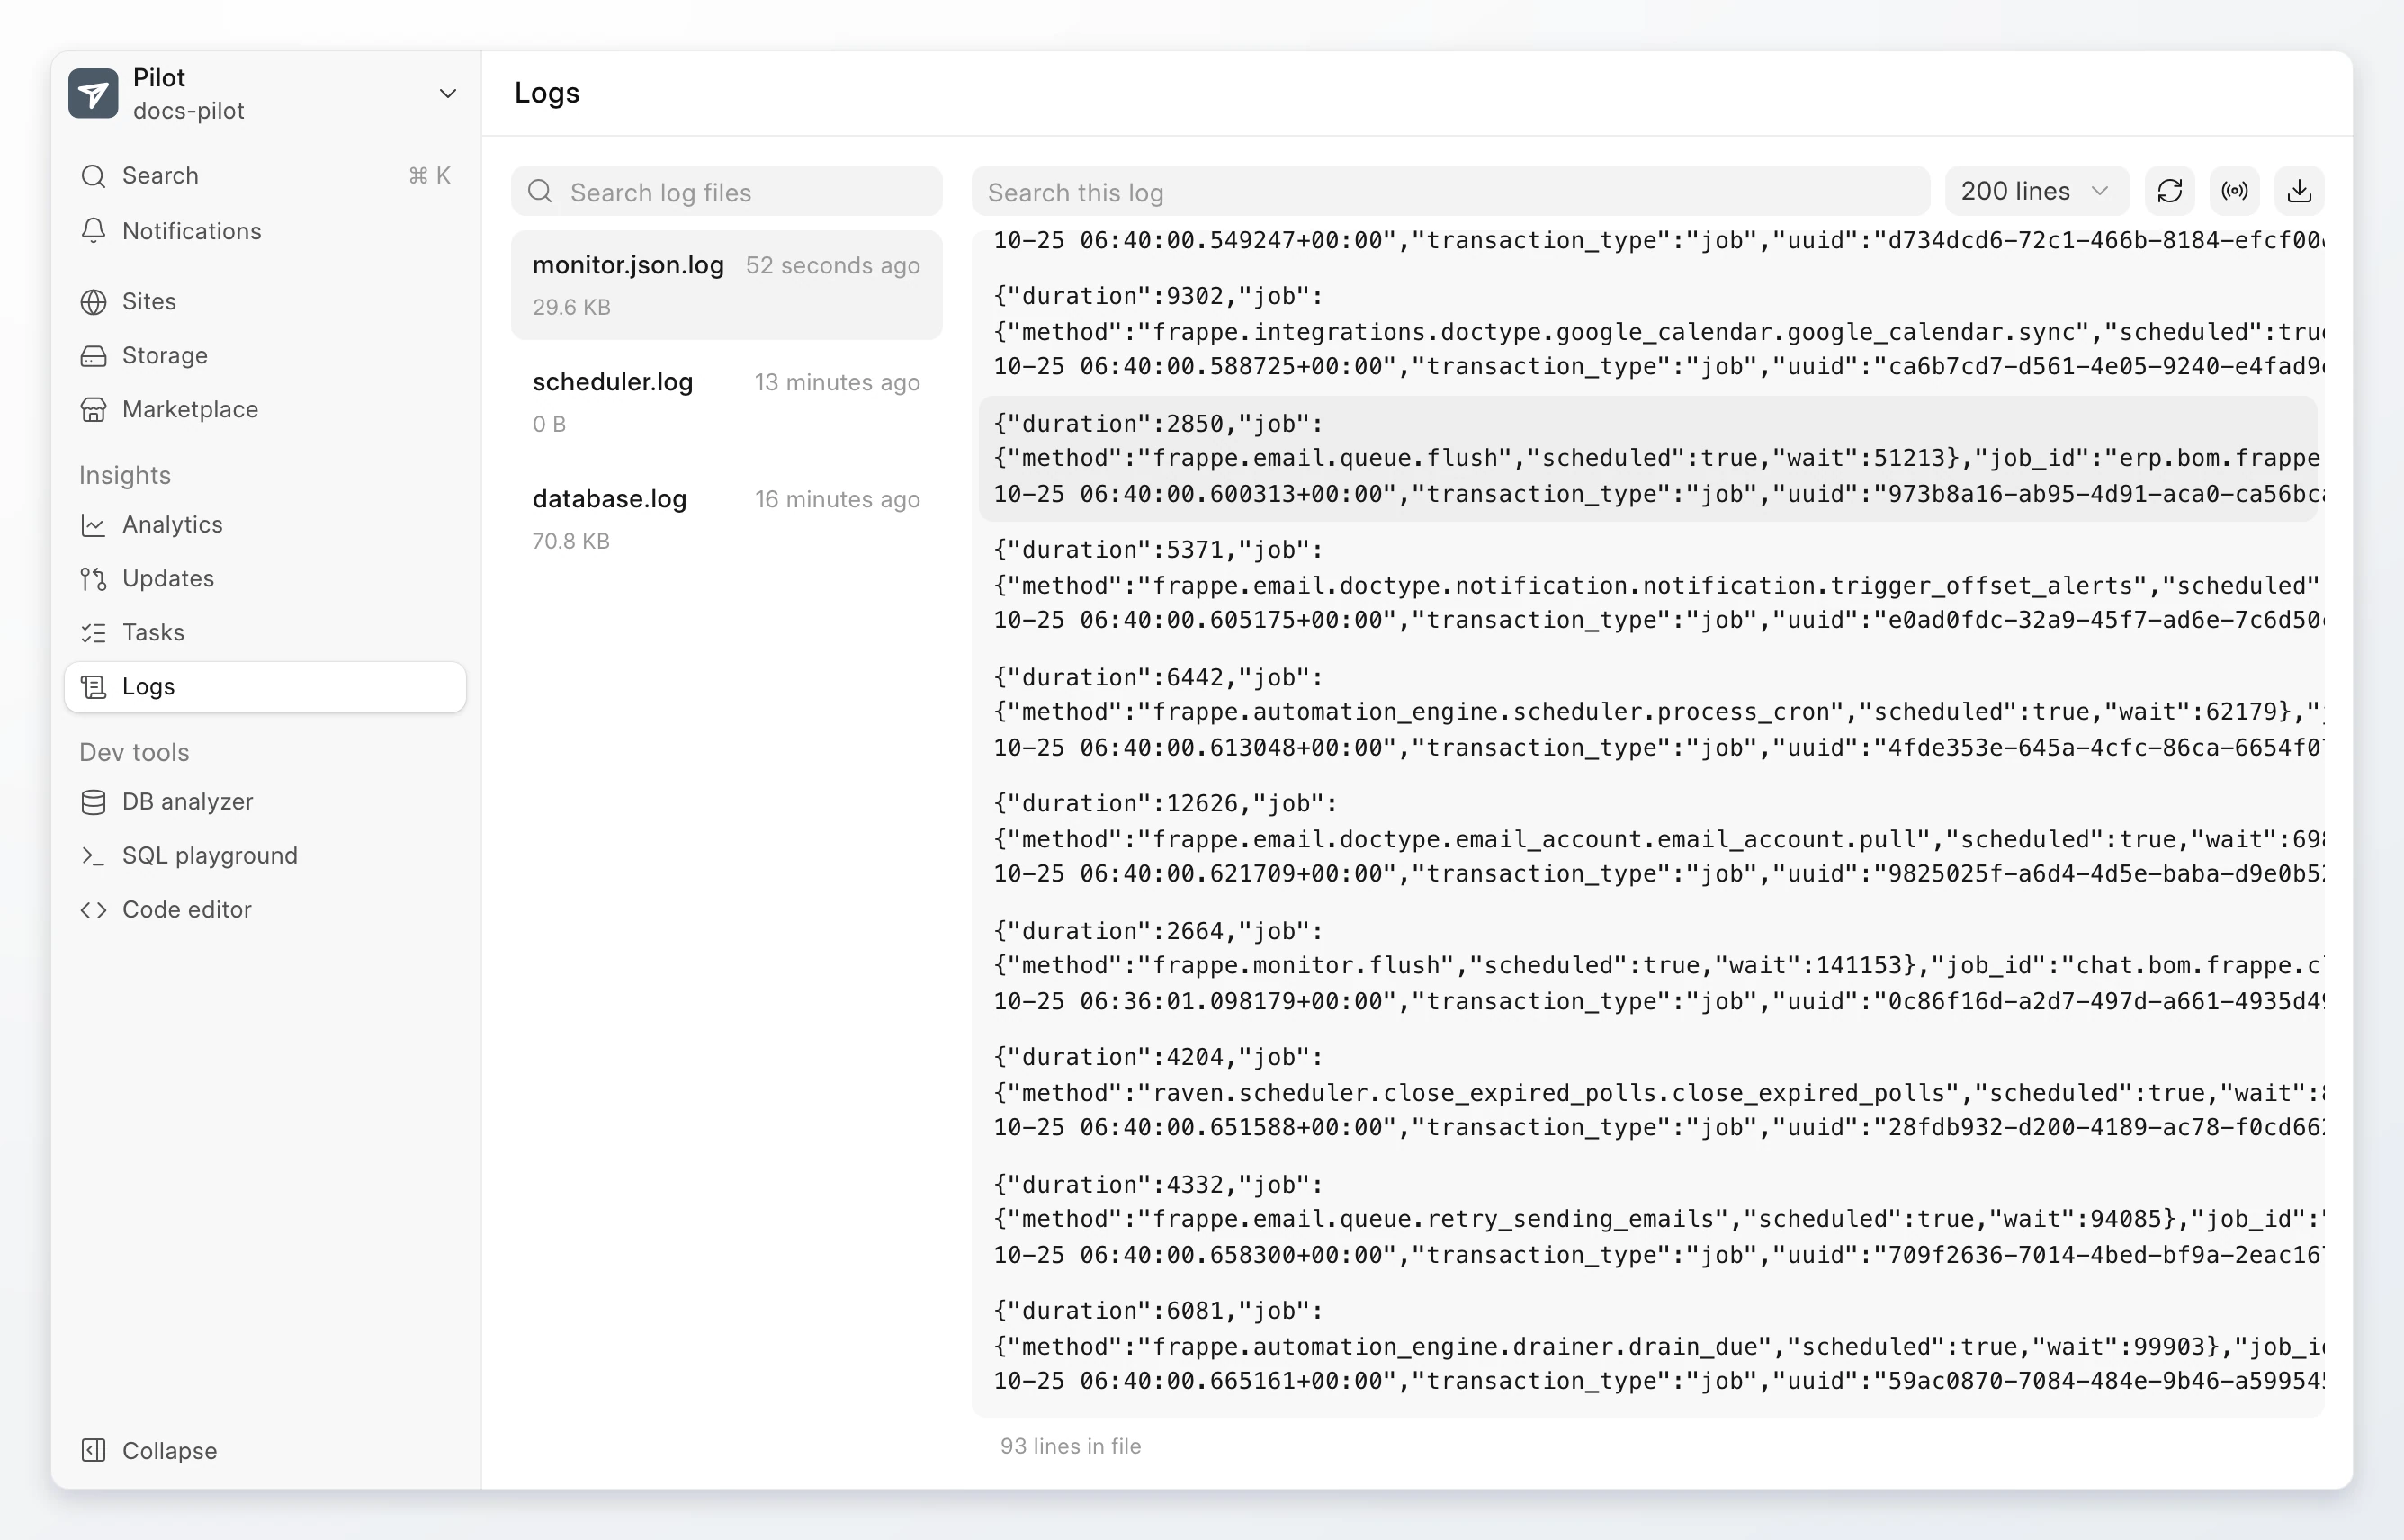
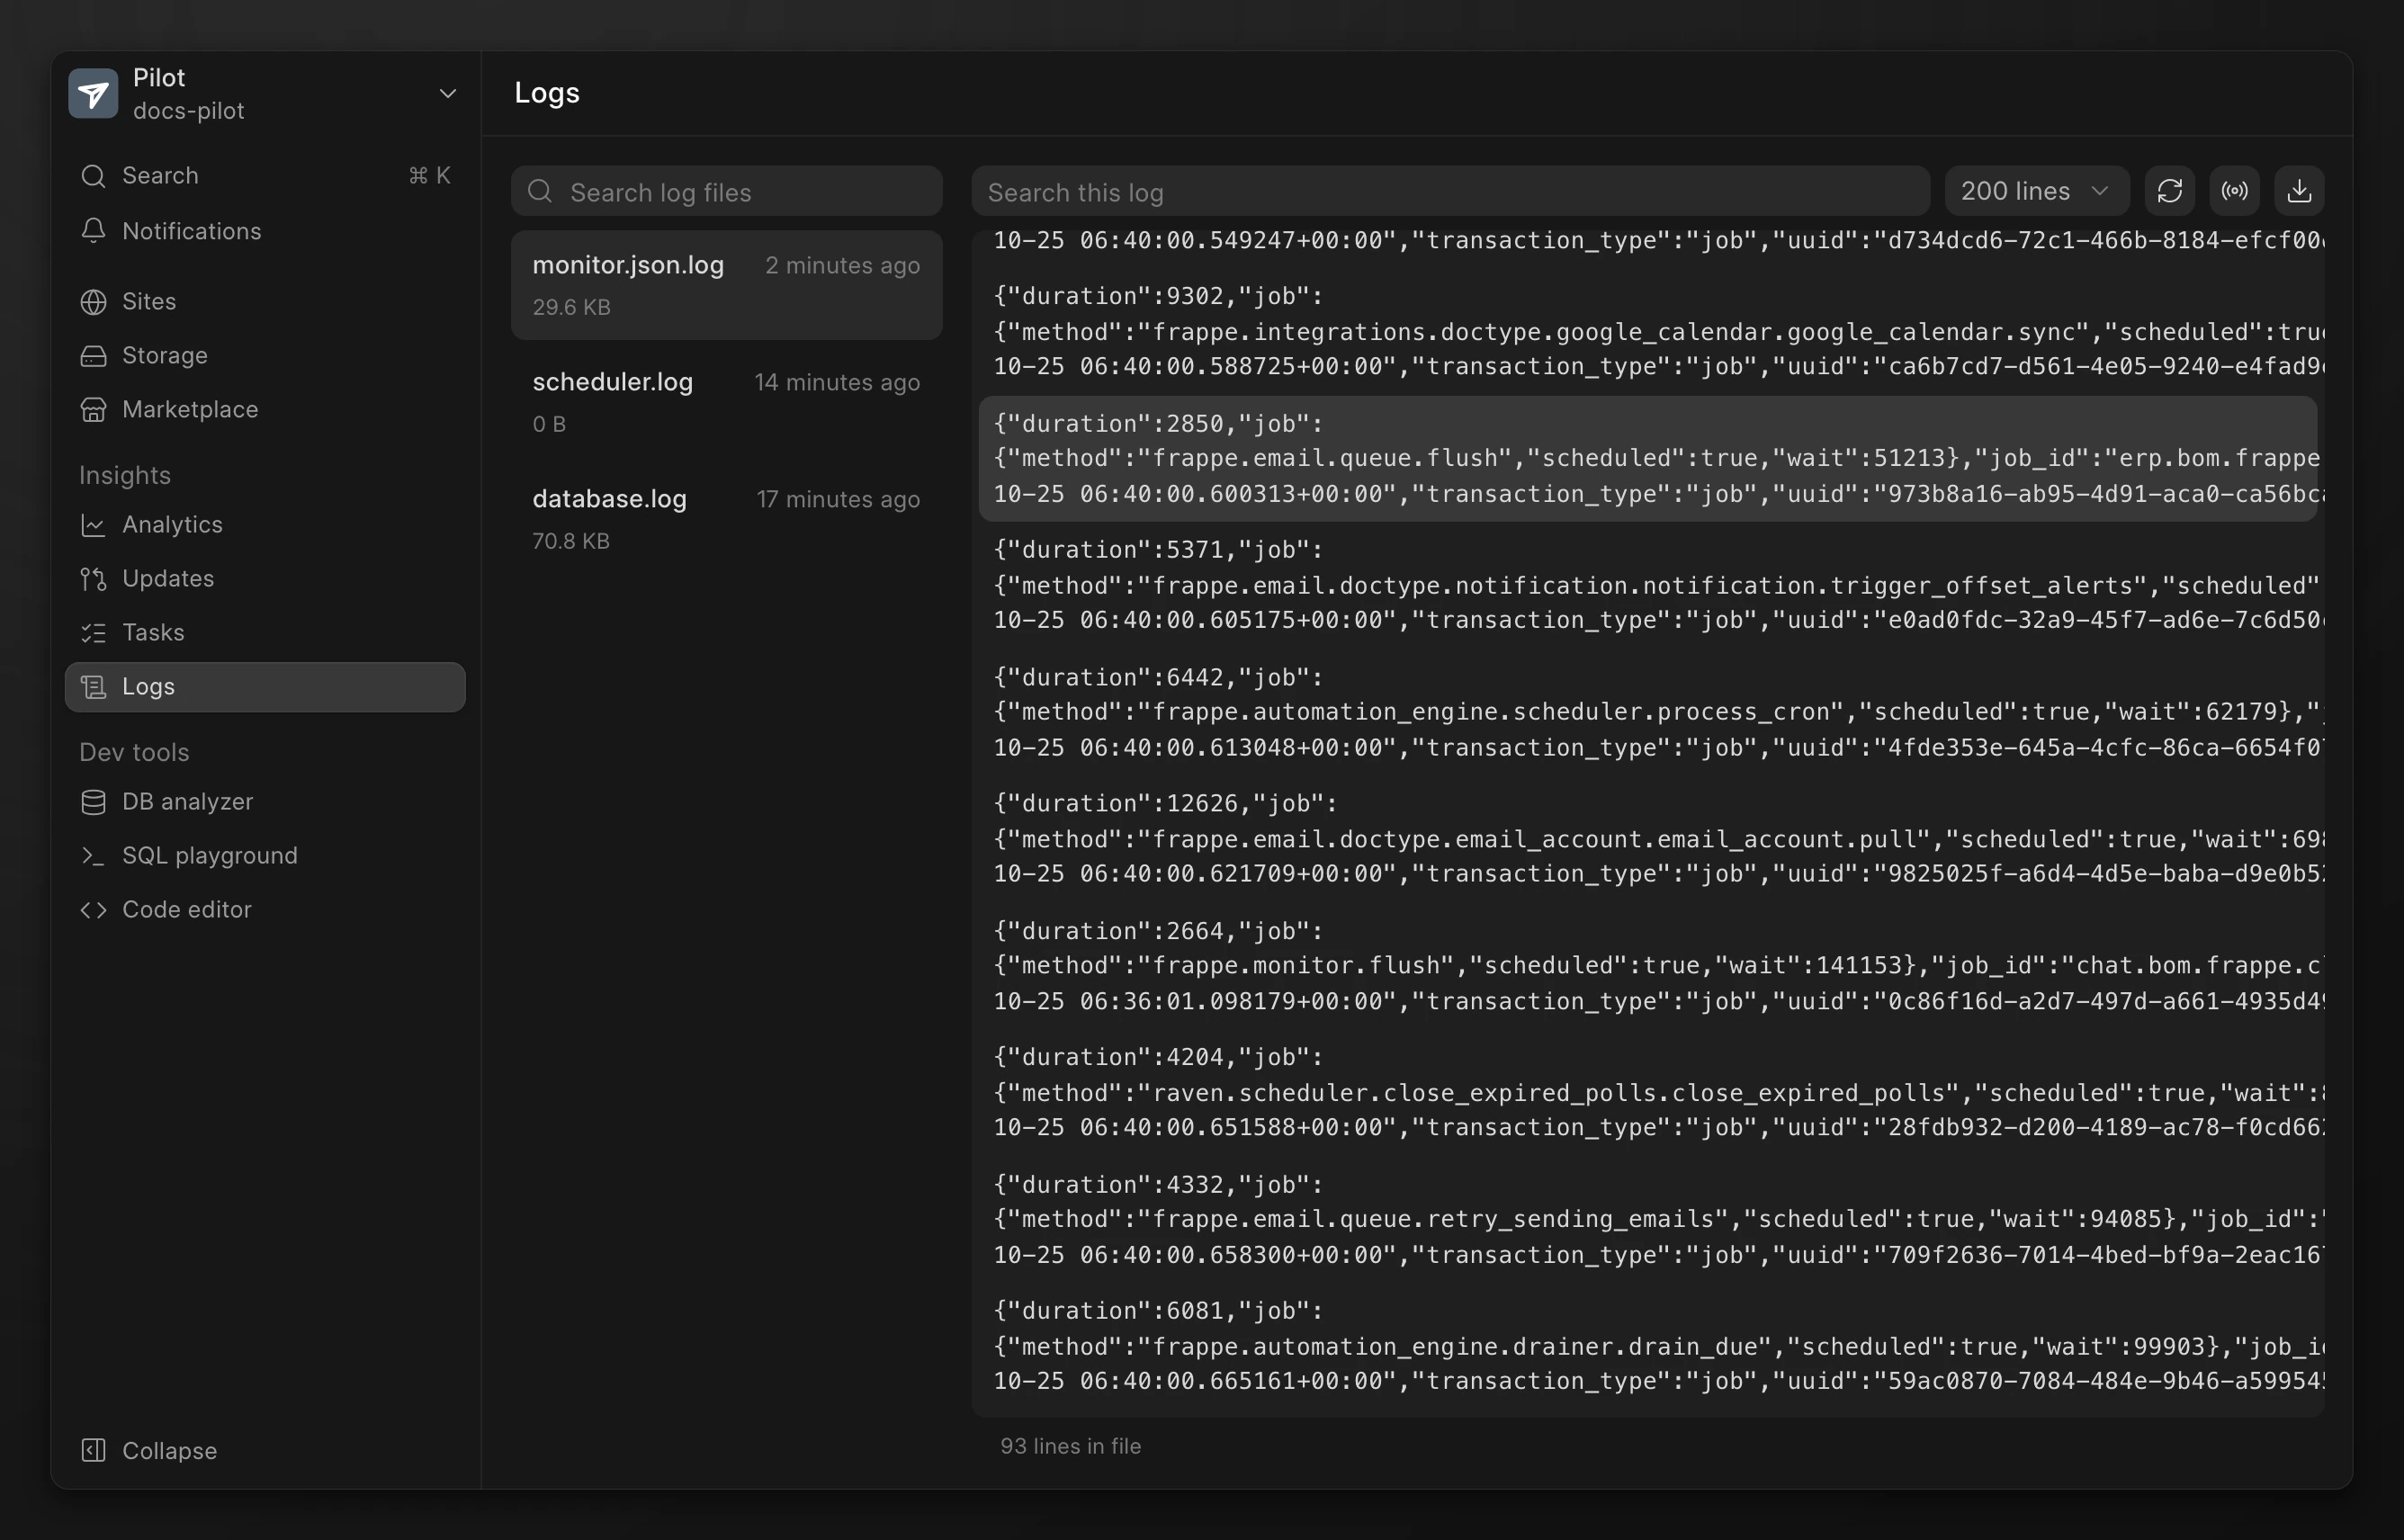
| Control | What it does |
|---|---|
| Contains errors | Marks a file that has error lines. |
| Live tail | Shows new lines as the process writes them. Click Stop live tail to stop. |
| Download | Saves the log file to your computer. |
| Refresh | Reads the file again. |
Activity
Go to the Pilot menu. Click Activity. The page lists each action with its time, its resource, and who triggered it. Filter the list by site or by type. Click View details for the full record.
The Activity tab on a site page shows the actions on that site only.
Analytics
Go to Analytics to see CPU, memory, storage, and database use. Select Server for the whole server, or select a site. Then select a time range, from 30 minutes to 1 week.
To see the usage of the server from the console, read Monitor usage.