Monitor usage
The Overview tab of a server shows how much CPU, memory, disk, and network the server uses. Use it to find a server that needs a larger plan, or a server that is too large.
Go to Servers. Click a server. The Overview tab opens.
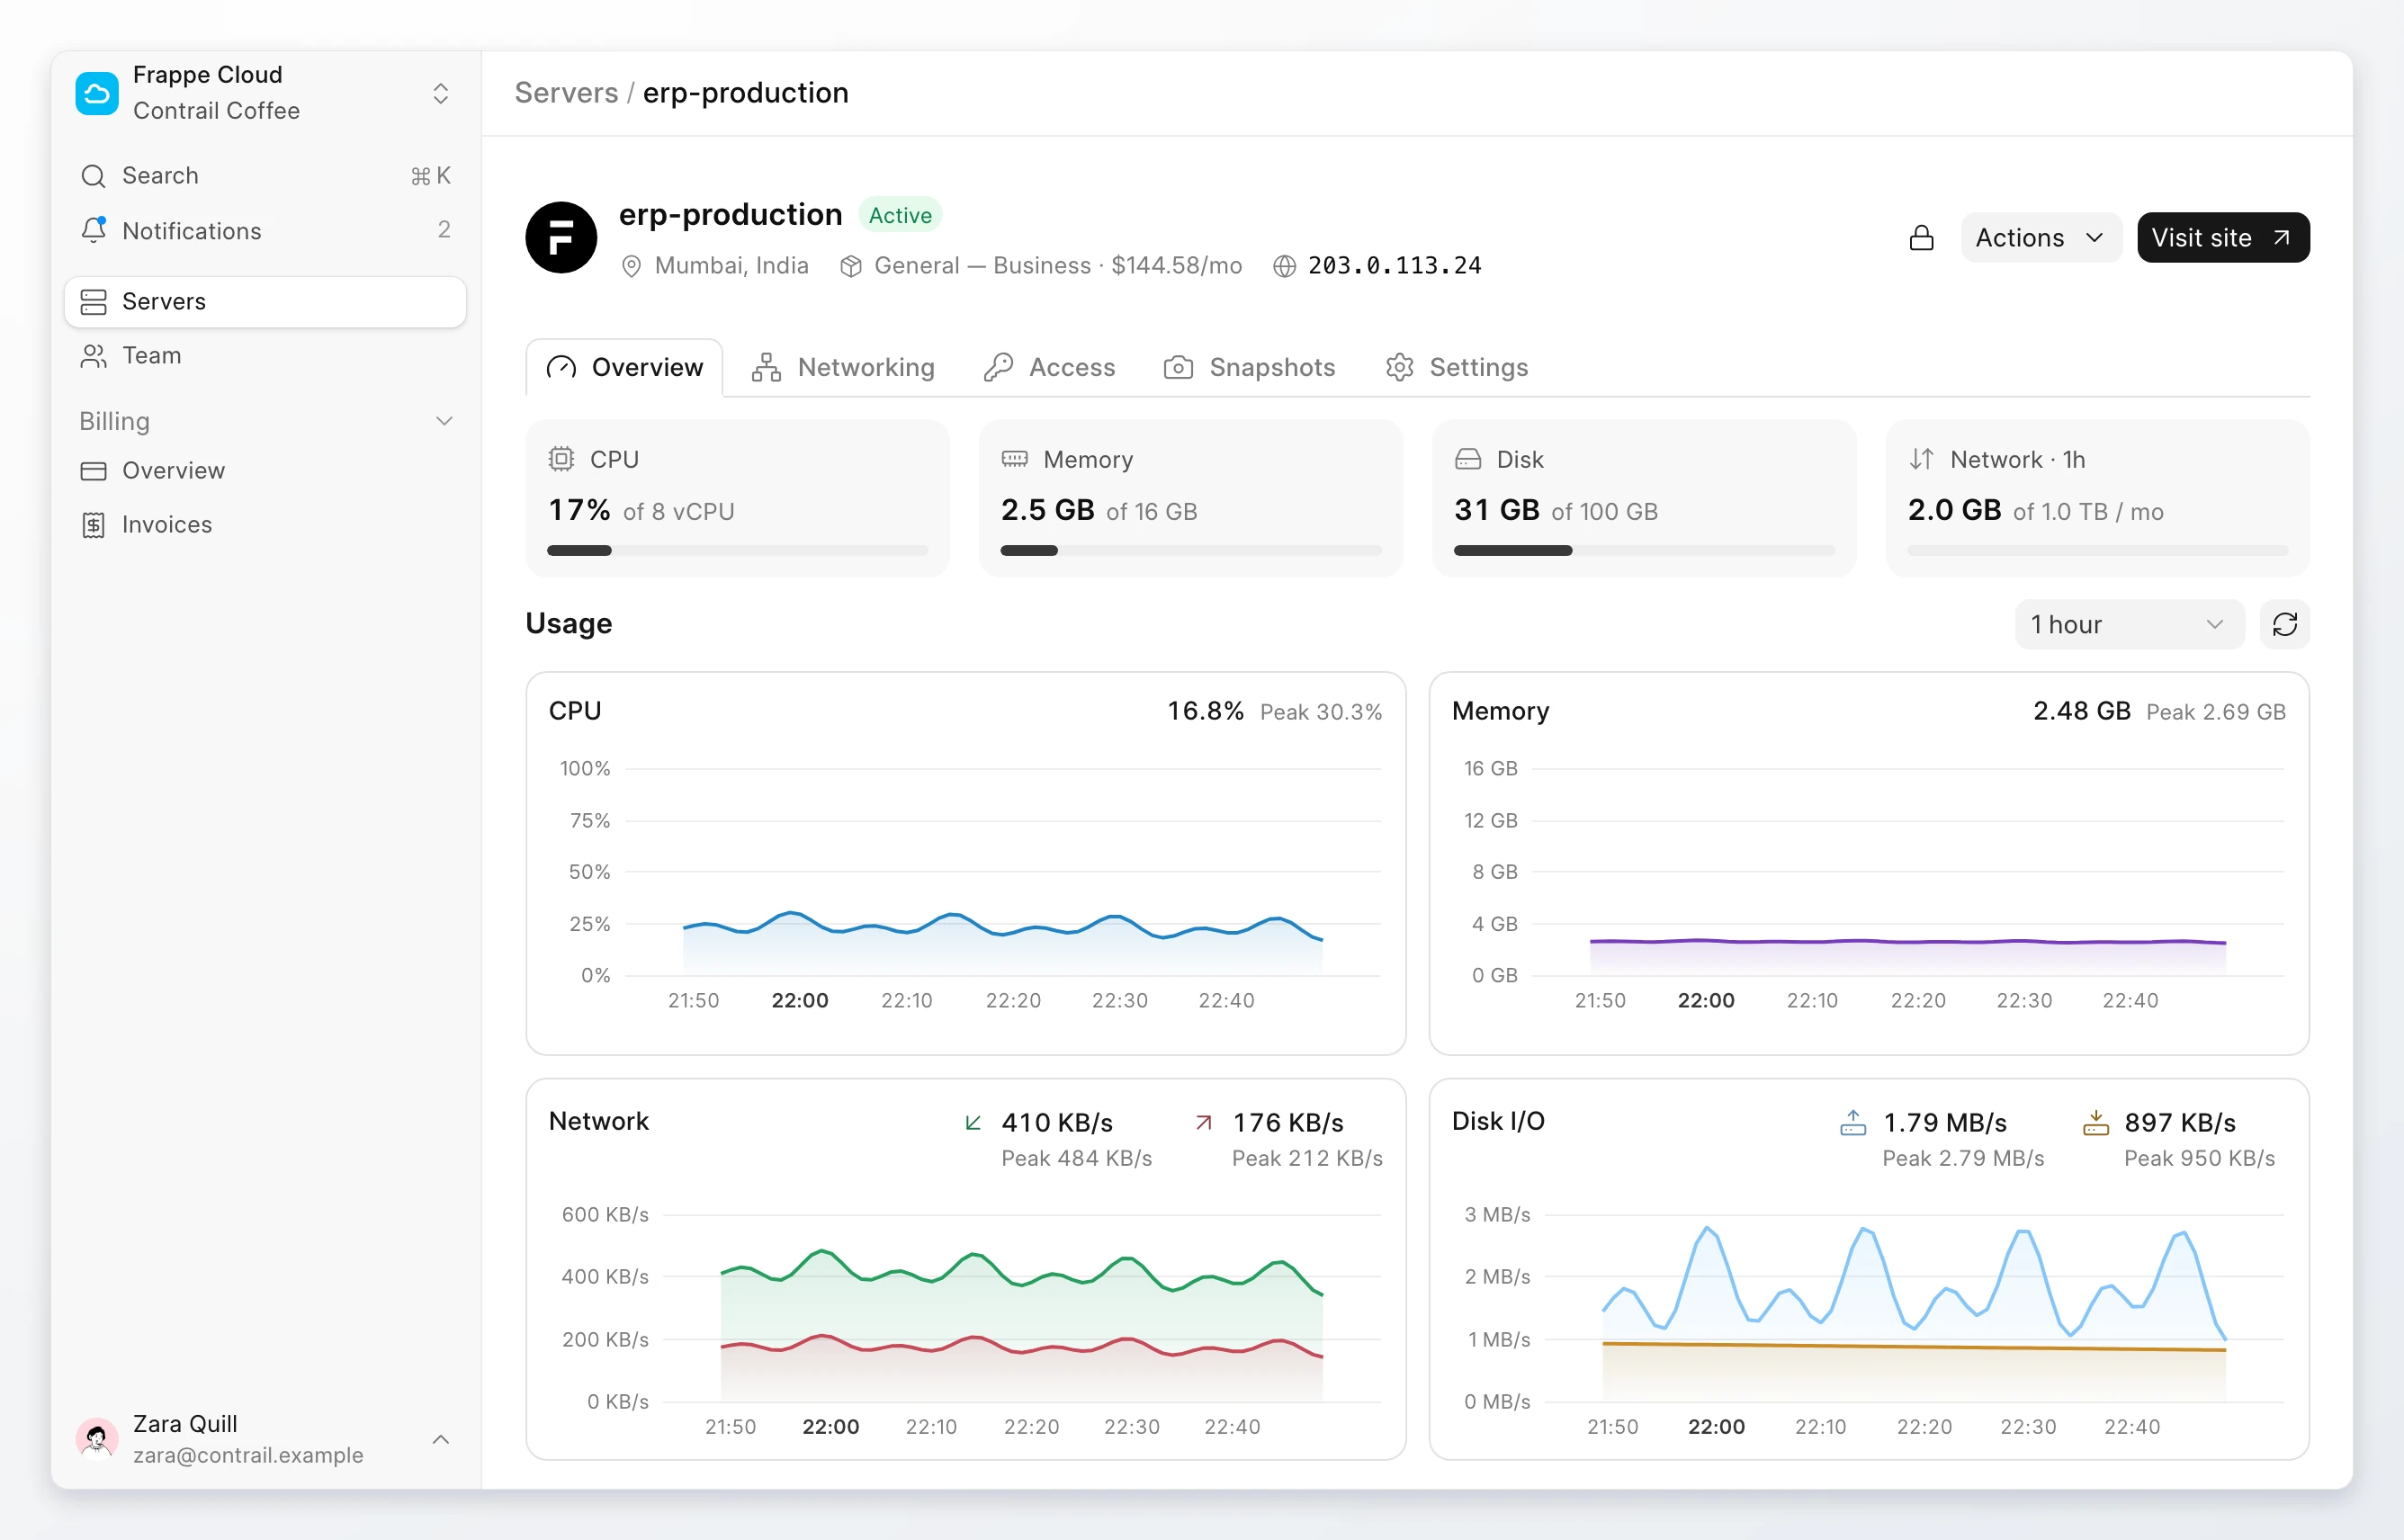
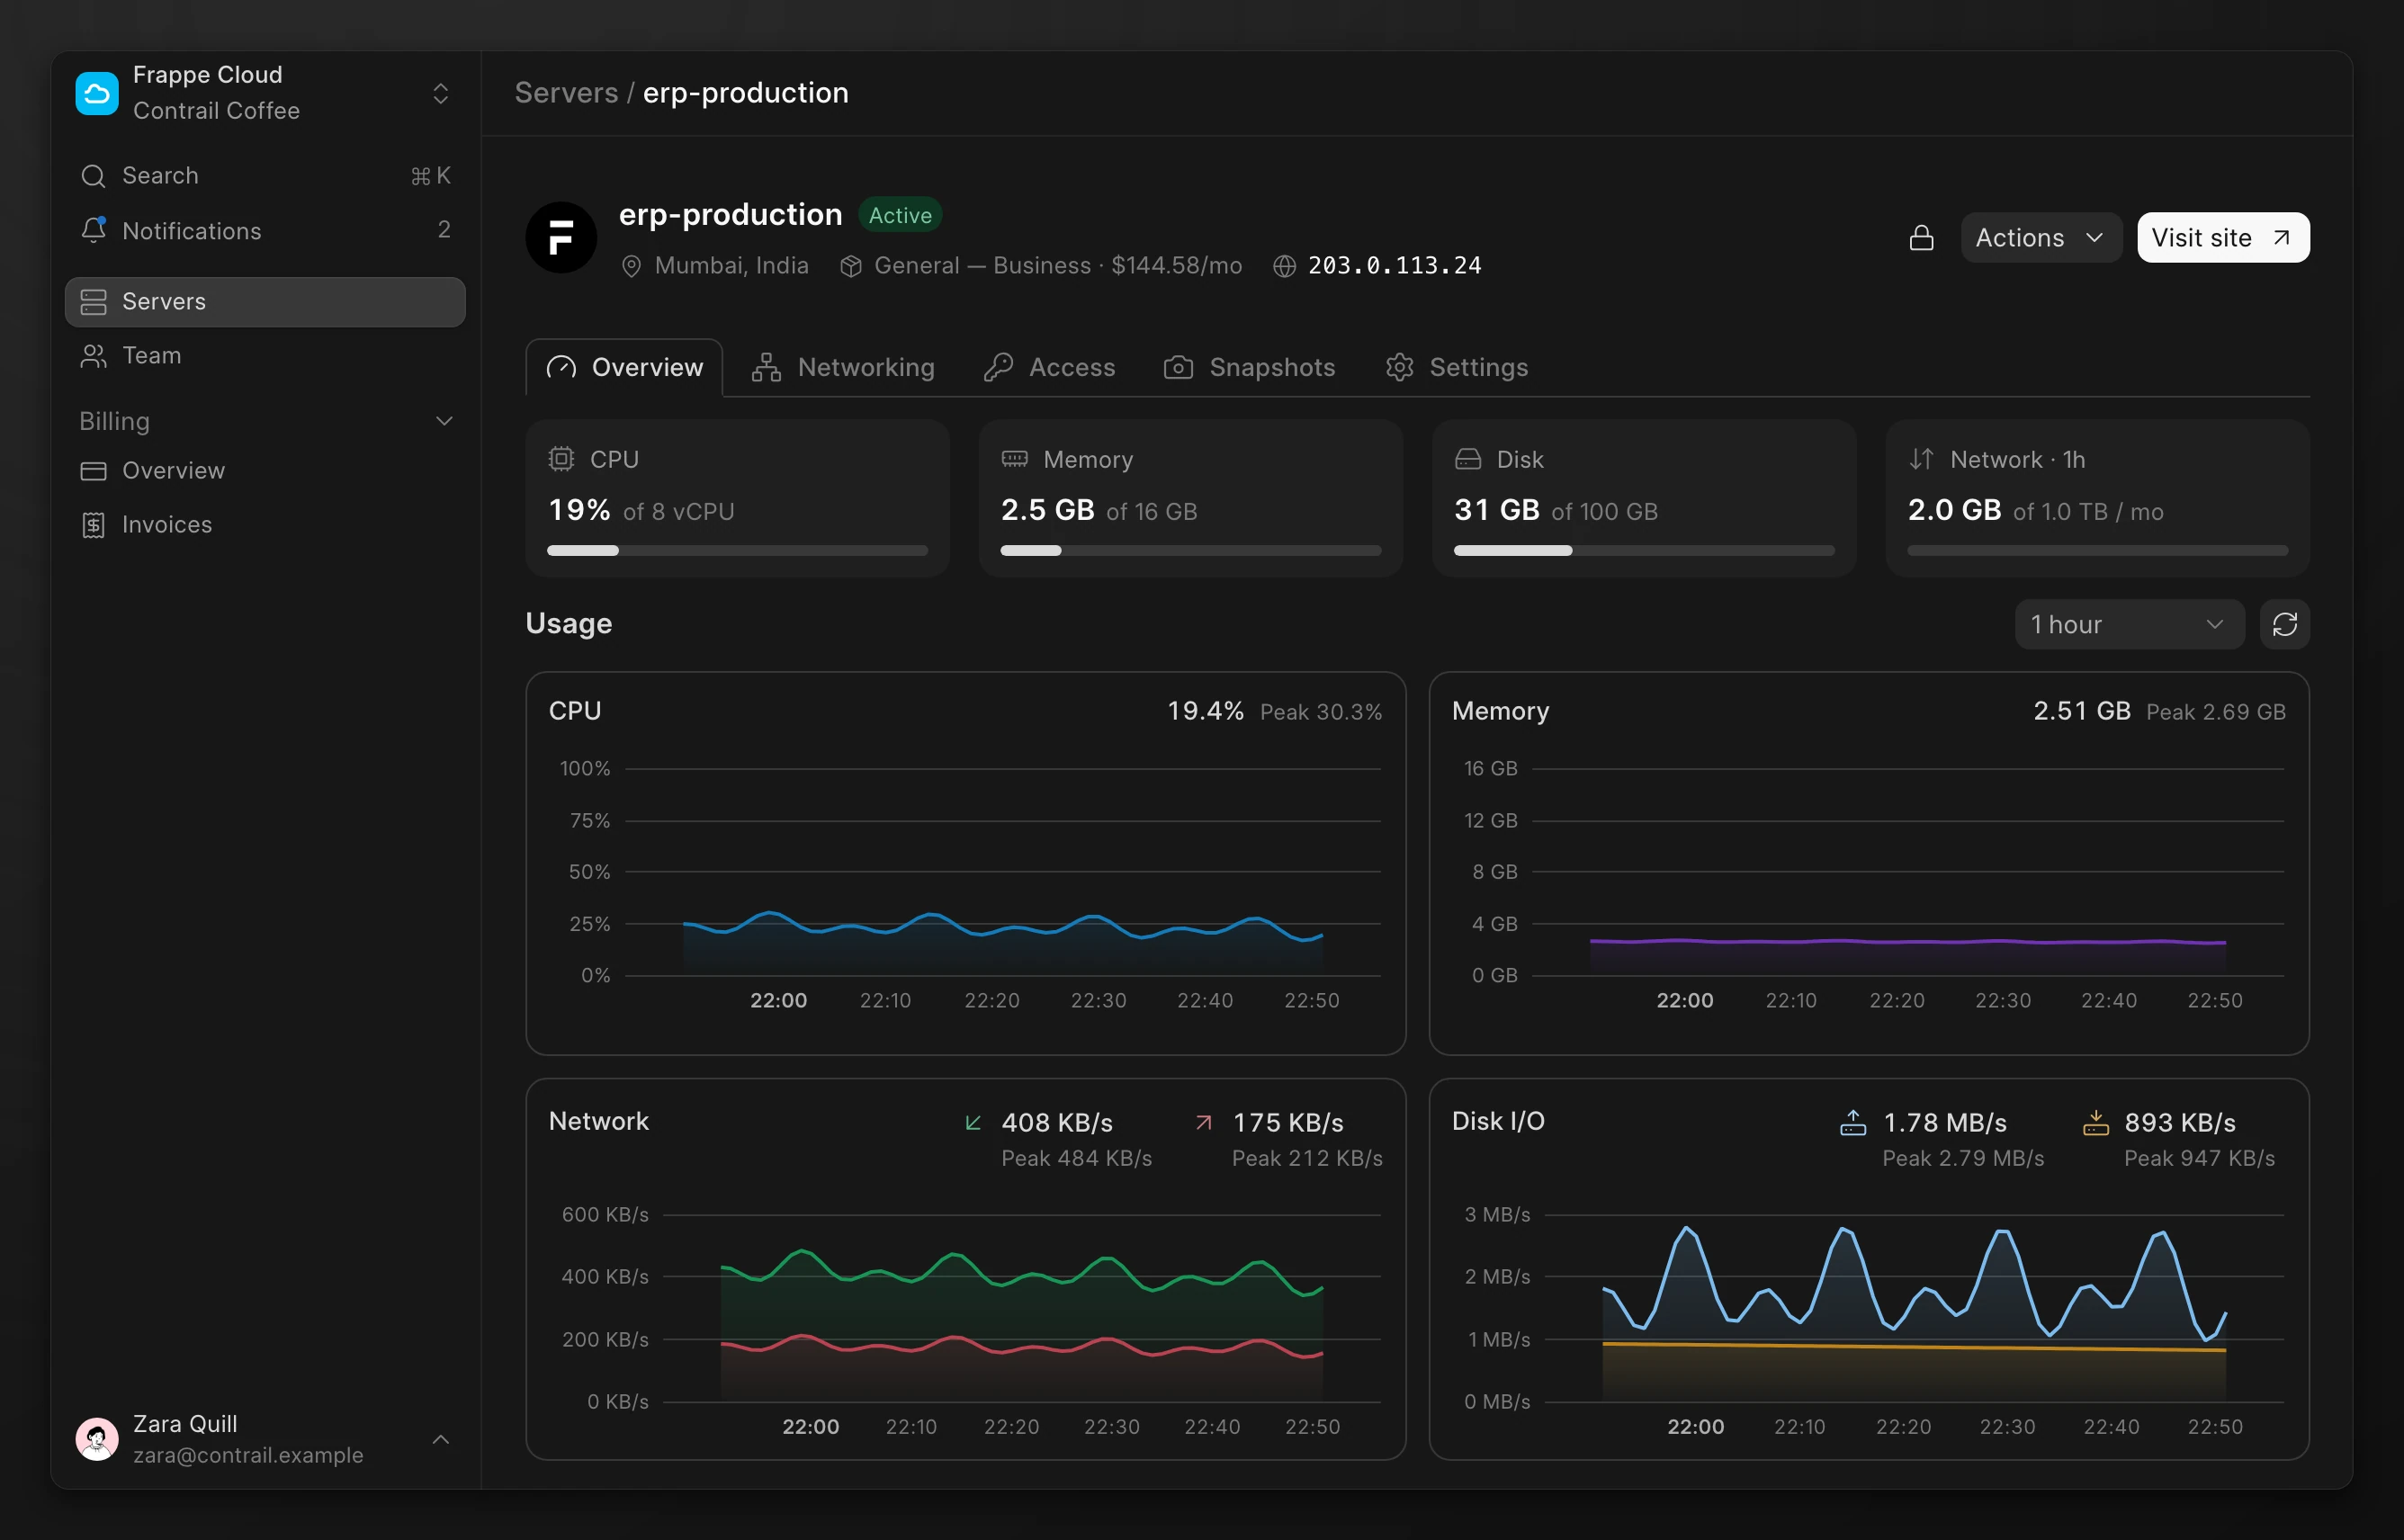
Usage cards
The cards show the newest sample.
| Card | Shows |
|---|---|
| CPU | The CPU use as a percentage of all the vCPUs of the server. |
| Memory | The memory in use and the total memory. |
| Disk | The disk space in use and the disk size. |
| Network | The data that the server sent and received in the selected period. It also shows the transfer that the plan includes each month. |
Charts
| Chart | Series |
|---|---|
| CPU | CPU use in percent. |
| Memory | Memory in use, in GB. |
| Network | Received and Sent, per second. |
| Disk I/O | Read and Write, per second. |
Each chart shows the current value or the average, and the peak in the period. Click a series name to hide it or show it again.
Change the period
Select a period in the list above the charts:
- 1 hour (the default)
- 24 hours
- 7 days
- 14 days
- 30 days
- Custom: select a Start and an End.
Click Refresh to load the newest samples.
Limits
- The region samples each server every 5 minutes.
- A custom period can be 30 days or less.
- The region records samples only while the server runs.
If there is no data
| Message | What to do |
|---|---|
| No usage yet | Charts appear while the server runs. Start the server, or wait for the first sample. |
| No samples in this period | Select another period. If the server started a few minutes ago, wait for the next sample. |
| Usage couldn't load | Click Retry. |